Energy Data
There are two main data sources on Icelandic energy:
- Energy data provided by the Icelandic National Energy Agency (NEA).
- Energy data as presented by Statistics Iceland (SI).
The data presented below is according to the most recent information from the NEA.
————————————————————————————————————————————————————–
TOTAL ELECTRICITY GENERATION: 18,798 GWh (2015)
————————————————————————————————————————————————————–
ELECTRICITY GENERATION SHARE BY SOURCE:
| Hydro Power | 73% |
| Geothermal Power | 27% |
| Other (including Fossil Fuels) | 0% |
| Total | 100.00% |
NB: A small portion of the electricity in Iceland is generated by wind power and fossil fuels. This generation is such a small amount it can not be measured as a percentage on the scale of this table.
————————————————————————————————————————————————————–
ELECTRICITY POWER CAPACITY:
| Hydro Power | 1,986 MW |
| Geothermal Power | 665 MW |
| Wind Power | 3 MW |
| Fossil Fuels | 117 MW |
| Total Power Capacity | 2,771 MW |
————————————————————————————————————————————————————–
ELECTRICITY CONSUMPTION SHARE:
| Energy Intensive Industries | 77% |
| General Consumption | 18% |
| Other | 5% |
| Total | 100% |
————————————————————————————————————————————————————–
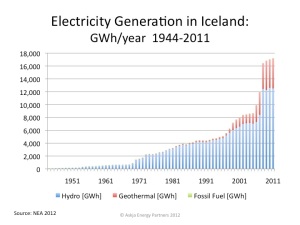
 Iceland is the world’s largest electricity producer per capita (Norway comes in second place, by generating approximately half the energy per capita of that of Iceland). The graph at left shows the annual electricity generation in Iceland since 1944 (this was the year Iceland became an independent country).
Although Iceland started utilizing its hydropower already in the early 20th century, it was not until the late 1960’s that the abundant Icelandic hydropower source attracted foreign investment. The first large hydropower station in Iceland was built in connection with the construction of an aluminum smelter in Southwest Iceland.
Several more hydropower stations were added in the 1970’s and 1980’s. The steady growth of hydropower during this period can clearly be seen on the graph (above).
Later, geothermal power in Iceland also became an important source for electricity generation. Today, geothermal power counts for more than 1/4 of the total electricity generation.
Almost all electricity in Iceland is produced by harnessing renewable sources (hydro and geothermal). Fossil fuels account for less than 1% of the electricity production. Thus, the electricity generated by fossil fuels can hardly been seen on the graphs. In total, about 85 percent of the primary energy supply in Iceland is derived from domestically produced renewable energy sources.
 The second graph (at left) illustrates the electricity generation in Iceland each year in the period 1990-2011. A major production increase can be seen in 2008. This was the year when the Kárahnjúkar / Fljótsdalur Hydropower Station started operating. The station accounts for almost 1/3 of all current hydropower capacity in Iceland (690 MW of total 1,986 MW).
For access to more statistical information about the Icelandic power sector, the Icelandic National Energy Agency (NEA) and Statistics Iceland (SI) both provide historical numbers and most recent data.


