Skip to content

Posts from the ‘World Energy’ Category

The most surprising energy fact?

Here at the Icelandic Energy Portal, we are very proud of the fact that power consumption in Iceland is almost totally based on renewable power sources. And when we look at gross energy consumption, Iceland is also the green leader.

iceland-coal-consumption-2015_askja-energy-partners-2017Therefore, it may be a surprising fact that Iceland is fast increasing its coal consumption. In fact the country is becoming a major user of coal (per capita).

According to information from the International Energy Agency (IEA), coal consumption in Iceland (per capita) is now almost on pair with the coal consumption in the United Kingdom (UK). As can be seen on the graph at left.

In the coming years, it is expected that coal consumption (per capita) in Iceland will grow quite fast. And soon become close to the present world average coal consumption (per capita).

Iceland has no coal power station. The reason for the growing use of coal in Iceland, is the heavy industries located in the country. They import and use the coal in their industrial process.

united-silicon-plant_helguvik-icelandIceland has a major aluminum industry and the aluminum smelters need carbon materials for the production. Also, Iceland has a fast growing silicon industry, which also uses coal in their production. These are the reasons why Iceland is becoming such a substantial coal consumer.

The growing use of coal in Iceland in the coming years, is all related to new and upcoming silicon plants. These industrial plants are the main reason why Iceland is scoring much higher on the list of coal consuming countries, than people in general may assume.

Cost of IceLink power cable: 2.8 billion EUR

According to a new report by Kvika Bank and Pöyry, prepared for the Icelandic Ministry of industries and Innovation, a subsea power cable between Iceland and the United Kingdom (UK) will cost EUR 2.8 billion (USD 3.1 billion).

HVDC-Icelink_Cost_Feb-2016-3This central cost scenario includes the 1,200 km long cable with a capacity of 1,000 MW, and the converter stations at both ends of the cable. When adding the onshore transmission installations needed in Iceland for connecting the cable to the power system, the total cost (central scenario) will be close to EUR 3.5 billion (USD 3.9 billion).

The report and additional material on the IceLink-interconnector can be downloaded from the Ministry’s website (the report is in Icelandic only). Note that all cost figures quoted in this article refer to the report’s central export scenario (there are several other scenarios, including a smaller cable of 800 MW).

To realize the project, it will be necessary for the British government to make a commitment of a minimum strike price of approximately 96-99 GBP/MWh (close to 130 USD/MWh).

HVDC-Icelink_strike-prices_Feb-2016-2Such a strike price would be quite similar to the strike price for new nuclear energy in the UK (as explained on the website of the UK government). And it would be substantially lower than recently agreed strike prices for new offshore wind power.

Now it has to be seen if the UK government wishes to pay GBP 115-120 for megawatt-hour of offshore wind power generated in British waters, or pay GBP 96-99 GBP for Icelandic renewable energy.

It should be noted that most of Iceland’s generation is and will be produced by hydropower and geothermal power (wind power in Iceland will increase but still be fairly small share of the total generation). This offers IceLink the possibility of much more flexibility than new British offshore wind power does. We, here at Askja Energy Partners, will soon be explaining further how the Icelandic power for IceLink will be generated.  Stay tuned!

Iceland is the greenest energy country in Europe

EU-EFTA-Renewable-Share-in-Gross-Energy-Consmuption_Askja-Energy-Partners-2016Probably not many of our readers are aware of the interesting fact that apart from the Scandinavian countries, Latvia is the greenest energy country in the European Union (EU). Only Sweden and Finland have a larger share of green energy in their gross energy consumption. However, the two greenest energy countries in Europe are Iceland and Norway (who are not members of the EU, but members of the European Free Trade Association; EFTA).

On the graph above you can see the share of renewable energy (percentage) in gross final energy consumption of each country within the EU and EFTA (the bars show the top-20 countries).

Iceland and Norway are clearly the leaders, with 77% and 69% renewable energy share respectively (in gross energy consumption). Having in  mind that no country in the world generates as much green power per capita as Iceland, it is not surprising that Iceland has the highest share of renewable energy in the gross energy consumption of all the states within EU and EFTA (with regard to energy consumption, Iceland is actually the greenest of all countries in the world).

Have in mind that the average share of renewable energy in the gross energy consumption of all the countries within the EU is currently close to 16%. And EU has the official and binding goal of increasing this share to 20% no later than 2020.

Europe-Renewable-Share-in-Gross-Energy-Consmuption_Askja-Energy-Partners-2016It is also worth noting that there are European countries outside of EU and EFTA that have very high share of renewable energy in their gross consumption mix (as can be seen on the graph at left). This especially applies to Albania (31%) and Montenegro (37%), which puts these countries in 6th and 8th place respectively (on the European list).

It is also interesting how extremely low the share of renewable energy is in Russia’s gross energy consumption (even hough Russia is the world’s fifth largest hydropower producing country). Also note how low the share of renewable energy is in countries like the UK and Holland. They need to do much better! Finally, note that not all European countries are included on the graph (countries that are not included in the data published by Eurostat, apart from Russia).

Main sources:
Eurostat – Information about consumption of energy
Eurostat – Share of renewable energy in gross final energy consumption
Eurostat – Energy from renewable sources (table 1).

European countries not included on the list above:
Andorra, Armenia, Azerbaijan, Belarus, Bosnia and Herzegovina, Georgia, Kazakhstan, Lichtenstein, Moldova, Monaco, San Marino, Ukraine, and the Vatican.

Oil prices must rise… some day

In last February we published an article explaining that the then very low oil price (31-32 USD/barrel) were not sustainable. In the article we focused on why oil prices will soon need to be approaching 60 USD/barrel and then head towards approximately 80-90 USD/barrel.

Oil-Supply-Demand-IEA__2016-2017_June-2016Now, only five months later, the price of oil is close to 50 USD/barrel. This does not mean that higher oil price is here to stay, nor does it mean that a price close to 80-90 USD/barrel is just around the corner. The world is still experiencing quite higher crude oil supply than consumption (demand), which can also be described as over-supply of crude oil. This means that oil price may stay quite low for some time (and even become lower than it currently is). But looking a bit further ahead, the price of oil will need to be approaching 60 USD/barrel and then head towards 80-90 USD/barrel. Else, there will not be enough oil for the world.

The graph above is from IEA’s June report, predicting that oil supply and demand is heading fast towards balance, supply to be outstripped by demand in the second half of 2017. Although this prediction by the IEA may be somewhat optimistic, i.e. it may take longer time for reaching balance in the oil market, it is obvious that in the long run the over-supply will vain. And then we will eventually again experience substantially higher price for crude oil than we have today.

Oil_Global-Liquids-Supply-Cost-Curve-Explained_Askja-Energy-Partners_June-2016To explain this further, we have updated our chart (at left) explaining the cost of future’s oil production. The graph shows where the world’s oil will come from in 2025 and at what cost.

In 2025 very substantial amount of the world’s oil will come from currently producing oil fields. However, due to decline in those oil fields and due to growing oil consumption, we will also need oil from new fields (which have already been discovered and are being developed). And to be able to bring those fields in production, we will need quite high oil price.

Large share of the oil consumed in 2025 will be coming to the market even if the oil price will only be in the range of 60-80 USD/barrel. But if we are hoping to avoid oil supply crisis, the oil price needs to become even higher. Like close to 90 USD.

To ensure all this oil will be brought up from the ground, we will need substantially higher oil price than we have today. Thus, it is likely that within the next decade we will see the price of oil approach 90 USD/barrel (in present USD value).

Bogle-Vanguard-Nobody-knows-nothingOf course the oil price may in some periods become higher and sometimes it will be lower. And keep in mind that it is impossible to predict with any precision how oil consumption (oil demand) will develop in the world (the same applies to prediction for renewable energy growth). No one knows what the price of the black gold will be at a certain point of time in the future (remember the wise advice Jack Bogle received early in his carrier!). However, if the world economy is going to keep on growing, like we are used to, we will need crude oil.  And a lot of it. A decade from now it is unlikely we will have all that oil unless we are willing and able to cover a production cost of at least approximately 90 USD/barrel.

The unknowns are many and the oil markets are extremely sensitive to all kinds of events. We don’t know how the economy in Asia will grow in the coming decade. And we don’t know if we are soon to experience enormous growth in new types of vehicles, using electricity instead of fossil fuels.

BNEF-EV-Sales-Prediction-2016If the 2020’s will be the decade of the electric car, as Bloomberg New Energy Finance (BNEF) now predicts, oil demand may become a lot slower than the oil companies are assuming. Which could result in continued over-supply of oil. So it is to be seen how growing production – and lower costs – of EV’s, will affect investment decisions by the oil companies. Stay tuned!

Low aluminum price resulted in lower power tariffs

Power tariffs to aluminum smelters in Iceland are among the lowest in the world.

Power-Tariffs-to-Aluminum-Smelters-in-World-China-and-Iceland-2016Due to low aluminum price in 2015, electricity price to aluminum smelters declined in most parts of the world during 2015. The world average smelter power tariff fell by 12% in 2015, according to CRU Group. This drop can primarily be attributed to a 15% drop in China’s average power tariff. The average power tariff in the World excluding China also fell in 2015, decreasing by 8.2%.

The average power tariff to smelters in Iceland also declined in 2015, although the decline was less than in some other areas of the world. The result was that during 2015, the average electricity price from Icelandic power company Landsvirkjun to the aluminum smelters in Iceland, was approximately 2/3 of the world average tariff to such smelters.

Wider energy horizon

polarsyssel-helicopter-fafnir-offshoreThe Icelandic Energy Portal has been undergoing development and thus not been publishing new material for a while.

From now on, the Portal will have a wider horizon, covering energy issues in the Northern Atlantic and Arctic Regions. We will be your leading independent provider of energy information and expertise in the region, delivering news, independent analysis and critical knowledge on energy industry trends, energy markets, geopolitics, law, and strategy.

Examples of some of our upcoming subjects:

  • Toxic Loans of Icelandic Banks in the Norwegian Energy Sector.
  • Increased Danish Exports of Wind Energy.
  • Newfoundland Offshore Oil Licences Extended.
  • Unique Opportunity for Statkraft.
  • Electricity Tariffs to Aluminum Smelters in Iceland Declined in 2015.
  • Current Low Oil Prices are Not Sustainable.

—————————————————————

HVDC-Electricity-Cables-Connecting-Europe-and-North-America-via-Iceland-and-Greenland_Askja-Energy-Partners-2016The Icelandic and Northern Energy Portal is owned and developed by the Iceland-based energy consulting firm Askja Energy Partners. We deliver independent analysis, critical knowledge and data on energy industry trends, energy markets, geopolitics, law, and strategy. You can contact us through this link.

Data centers site selection

Which are the main decision drivers when companies are selecting location for data centers? This was the topic of an interesting presentation given Mr. Phil Schneider in Reykjavík earlier this summer. The event attracted high number of audience, which is not surprising as the date centre service in Iceland has great possibilities for strong growth.

Site selectors guild

Mr. Phil Schneider is the President of Schneider Consulting LLC and Chairman of the Site Selectors Guild. The Guild* is an association of the world’s leading site selection practitioners. Guild members provide location strategy to corporations across the globe and for every industry, sector and function.

Phil-Schneider_President-of-Schneider-Consulting_Chairman-of-the-Site-Selectors-Guild-in-Iceland-Askja-Energy-Partners-2015-2Mr. Schneider divided his presentation into three main parts. Firstly, he discussed the most important general issues that dictates the choice of companies regarding location of their business units. Secondly, Mr. Schneider described how this relates to the location of data centers. And thirdly, he discussed the challenges facing Iceland in attracting more investment in data centers in Iceland.

Strong growth potentials for Iceland

The data centre sector is growing rapidly all around the world. This trend creates interesting opportunities for Iceland in increasing diversity in the Icelandic economy. Due to extensive hydro- and geothermal resources, Iceland is able to offer more competitive long-term electricity contracts for data centers than available anywhere else in the western world (in addition, the Icelandic electricity is 100% green power).

Advania-Green-Data-Centre-IcelandThis is an important incentive for locating data centers in Iceland. Furthermore, Iceland has highly qualified workforce for this sector and a competitive tax system. However, Iceland needs to consider its marketing strategy and must present the necessary information in a way that is easily accessible. clear, and understandable.

Risk factors and misconceptions

Although site selection for data centers aims at being based on a thorough assessment of all the variables that may be relevant, it is quite common that misunderstanding regarding risk factors becomes a a major decision factor.  According to Mr. Schneider, companies often jump to wrong conclusions regarding risk factors. In the case of Iceland, foreigners may for example have the perceived feeling that Icelandic is a risky location due to earthquakes or volcanic eruptions. In fact, natural risks are a less threat to business operations in Iceland than in for example most areas of the USA. In this context, it is tremendously important to present correct and accurate information to avoid wrong assumptions or mistaken image.

The Icelandic energy portal plays an important role

Phil-Schneider_President-of-Schneider-Consulting_Chairman-of-the-Site-Selectors-Guild-in-Iceland-Askja-Energy-Partners-2015-5In his lecture Mr. Schneider emphasized the importance of good access to clear and reliable information about the Icelandic business environment and the energy sector. He especially referred to the Icelandic Energy Portal as such a source, regarding data center site selection. In the coming months we, at the Portal, are going to emphasize even stronger the issue of locating data centers and storing data in Iceland. Note that Mr. Schneider’s presentation can be watched here (starts at 36:22).

* Founded in 2010, the Site Selectors Guild is dedicated to advancing the profession of international corporate site selection by promoting integrity, objectivity, and professional development. Members are peer-nominated, vetted, and must demonstrate a significant amount of location advisory experience. Guild Membership is the highest standard in the site selection industry.

Electricity tariffs to aluminum smelters in Iceland

In this article you will find information about the electricity prices which the three aluminum smelters in Iceland paid to the Icelandic power company Landsvirkjun in the period 2005-2014. The information is based on several Icelandic and international reports.

  • The Norðurál smelter (Century Aluminum) pays the lowest tariff.
  • The Fjarðaál smelter (Alcoa) pays a slightly higher price than Norðurál.
  • The tariff to the Straumsvík smelter (Rio Tinto Alcan; RTA) is presently the highest.

Very low tariffs to Norðurál (Century Aluminum) and Straumsvík (Alcoa) are the reason for extremely low average price of electricity to aluminum smelters in Iceland. With regard to the low tariffs, it is not surprising that Century Aluminum has stated, that its Grundartangi smelter in Iceland “generates significant free cash flow in virtually all price environments”. The same situation is likely to apply to Alcoa’s Fjarðaál smelter, as it pays on average only approximately 10% higher price for the electricity than Norðurál (Century) does.

Since late 2010, the Straumsvík smelter of RTA has paid a substantially higher price for the electricity than the other two smelters. Before 2010, RTA enjoyed the lowest electricity tariff of all the aluminum smelters in Iceland. With the new contract between Landsvirkjun and RTA in 2010, the base price increased and the power tariff was no longer linked to the price of aluminum.

So far, the new contract between Landsvirkjun and RTA is the only energy contract with aluminum smelters in Iceland where the electricity tariff is not linked to aluminium price. Instead, the price in this new contract is adjusted according to US Consumer Price Index (CPI).

Although the tariff to RTA is much higher than to Alcoa and Century Aluminum, the price to RTA is quite modest. For example, it is much lower than the average price of electricity to aluminum smelters in the United States (USA). And the said tariff is similar or even lower than the average power tariff to aluminum smelters in Africa.

Aluminum-Electricity-Tariffs-to-Smelters-in-Iceland_2005-2014_and-World-Comparison_Askja-Energy-Partners-2015The graph shows the average annual electricity price paid by each of the three aluminum smelters in Iceland to Landsvirkjun, in the period 2005-2014. All prices on the graph include transmission. The red columns are the electricity price to Norðurál at Grundartangi (Century Aluminum), the green columns are the electricity price paid by the aluminum plant at Straumsvík (Rio Tinto Alcan; RTA), and the light blue columns are the tariffs to Fjarðaál in Reyðarfjörður (Alcoa). Note that readers should presume a confidence interval of 5%.

The tariff to Straumsvík (RTA) is currently approaching 35 USD/MWh. In 2014, the smelter in Straumsvík paid almost 45% higher power tariff than Fjarðaál (Alcoa), and close to 60% higher price than the aluminum smelter at Grundartangi (Century).

Landsvirkjun’s average price to the aluminum smelters in 2014 was slightly above 26 USD. Same price for aluminum smelters in Africa that year was about 30% higher, and comparable prices to smelters in the USA and Europe were close to 45% higher. For more information about average power tariffs to aluminum smelters in the world in 2014, we refer to our earlier post; Electricity Tariffs to Aluminum Smelters.

Historically, all electricity sales by Landsvirkjun to the aluminum industry has been linked to aluminum prices (until 2010). Therefore, the tariffs and Landsvirkjun’s revenues have often fluctuated dramatically – according to changes in price of aluminum on the London Metal Exchange (LME). Such fluctuation can clearly be seen on the graph above, especially with regard to the period 2008-2010. Note also that in 2006-08 the price of aluminum was exceptionally high, hence the power tariffs to the smelters in Iceland were unusually high in that period.

From 2019, more contracts with the aluminum smelters in Iceland will be expiring. With regard to the electricity price in the recent contract between Landsvirkjun and Straumsvík (RTA) and other new contracts with smelters in the world, it can be expected that the minmum tariff in renewed contracts with the smelters will not be under 35 USD/MWh (in 2014 prices), and possibly somewhat higher. We at Askja Energy Partners will be presenting frequent news and update on this interesting subject.

Electricity tariffs to world’s aluminum smelters

The graph below shows the average price of electricity to aluminum smelters in different regions of the world (in 2014). The graph both illustrates  the relative amount of aluminum production in the major aluminum production areas/countries, and the electricity tariffs. All prices on this graph include both electricity and transmission cost

Aluminum-Electricity-Tariffs-World-and-Iceland-Landsvirkjun-2014China has become the world’s largest aluminum producer. This is an interesting fact, not least when having in mind that the smelters in China pay on average much higher electricity tariffs than smelters elsewhere in the world.

Iceland is represented by red color on the graph. Note that the column for Iceland includes only the power sold to smelters from the National Power Company (Landsvirkjun). Two other power firms in Iceland also sell power to one of the aluminum smelters in Iceland (there are three smelters in Iceland, owned by Alcoa, Century Aluminum, and Rio Tinto Alcan). However, Landsvirkjun is by far the main electricity provider for the smelters in Iceland. Thus, the average electricity price to the aluminum smelters in Iceland is very close to the average price the smelters pay to Landsvirkjun. Which was just above 26 USD/MWh in 2014.

Aluminum production in Iceland is relatively unimportant in the global context (about 0.8 million tons of the total of close to 54 million tons in 2014). What is more interesting, is the fact that the electricity price the smelters pay Landsvirkjun (the average price) is one of the lowest in the world. In 2014, it was close to being exactly the same as the average price to smelters in the Middle East (which are mostly smelters in the Persian Gulf States, taking advantage of very cheap electricity from natural gas power stations). And the average price to smelters in Iceland is only slightly higher than the average price to aluminum smelters in Canada, and much lower than the tariffs to smelters in the USA.

However, the average price to aluminum smelters in Iceland is likely to increase substantially in the coming years – when major contracts are up for renegotiation.  Next such power contract is a contract between Landsvirkjun and Century Aluminum, regarding the Norðurál Smelter at Grundartangi. The present contract expires in 2019.

Does Apple not want truly GREEN data centers?

Denmark-Electricity-Sector-Mostly-Coal_March-2015
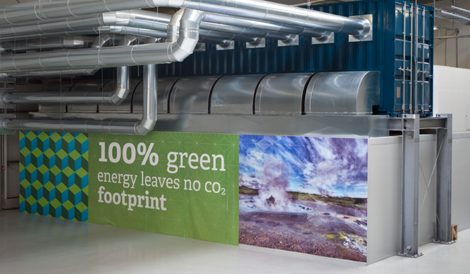
Is there such a color as coal-green? This question comes in mind when reading about Apple’s new data center in Denmark. Apple recently announced it will construct two new large data centers in Europe, both to be “run on 100 percent renewable energy”. According to a press release from Apple, “the new facilities will run entirely on clean, renewable energy sources from day one”. These are interesting statements, having in mind that both data centers will be connected to a grid which mostly delivers electricity from fossil fueled power production. Here we will consider if a data centre located in Denmark can truly be said to run all the time on 100 percent renewable energy.

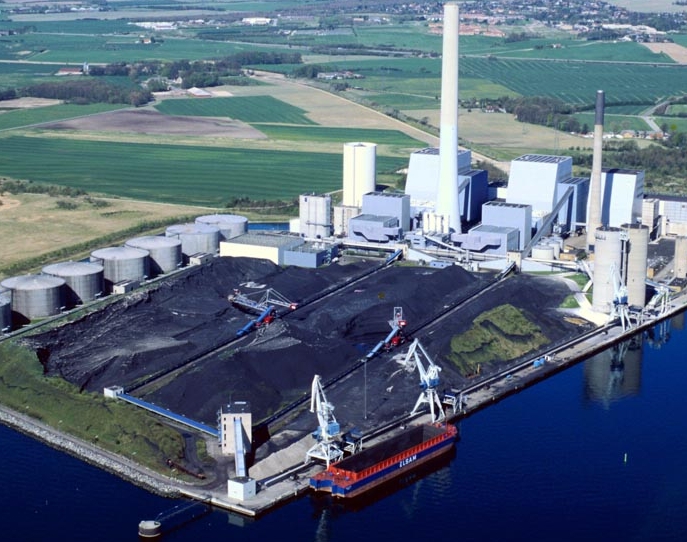
Denmark’s own power mix is dominated by coal

Denmark-Coal-Plant-Studstrupværket
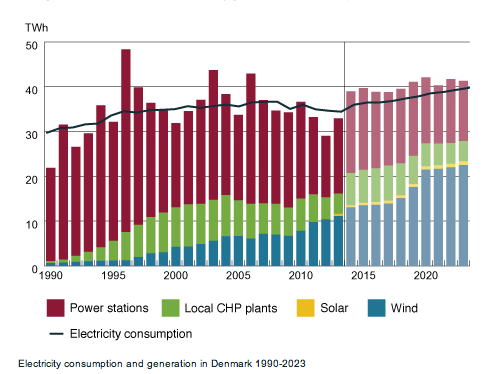
Denmark generates substantial amount of green energy. According to the most recent information from the European Union (EU), the renewable’s share of Denmark’s gross electricity consumption in 2012 was close to 40 percent. More recent information from the Danish transmission system operator (TSO), Energinet, tells us that the share of renewable energy in 2013 was somewhat higher than in 2012, but still less than half of the total electricity consumption (47.5 percent).

Denmark’s electricity is mainly generated by coal. The Danish government has plans to decrease the importance of coal, but coal still constitutes for more than half of the fuel consumption of Danish power stations. Most of Denmark’s renewable energy comes from wind, which is of course somewhat a fluctuating and unreliable energy source. In 2013 the share of wind in the electricity consumption was almost one-third (32.7 percent).

Connections to other countries are based on economics rather than green energy

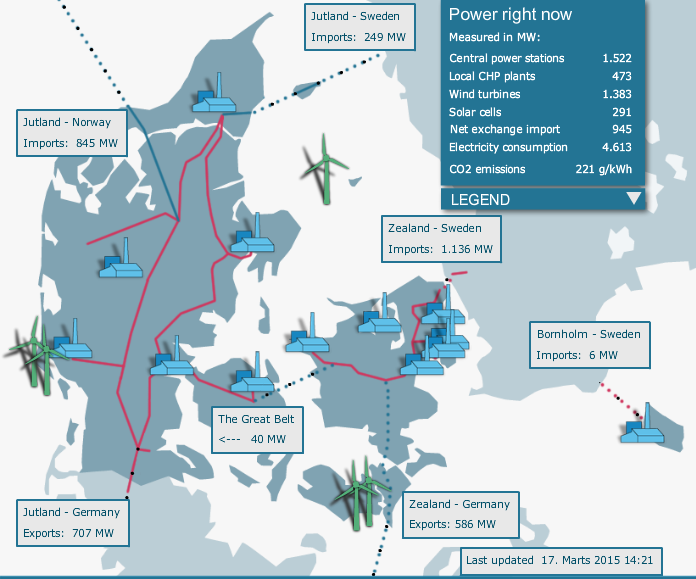
Denmark’s electricity grid is not an island, but connected with its neighbouring countries by several large cables. Therefore, Denmark sometimes exports electricity and sometimes imports electricity. Weather it is exporting or importing electricity depends on the price difference within the larger market area. Normally, Denmark exports electricity during night (because of its large wind power capacity) and imports during the day (when demand goes up and Norwegian and Swedish hydropower stations are utilizing the water in the reservoirs). However, imports and exports of electricity of course always depends very much on how the wind blows in Denmark.

Denmark imports power from coal-, hydro-, and nuclear power stations

When Denmark imports electricity, it comes via cables from Germany, Norway, and/or Sweden. The imported electricity can, for example, be generated by fossil fuels (major coal power in Germany), by nuclear power (nuclear stations in Sweden and Germany), or by hydropower (especially from Norway, but hydropower is also a major source in Swedish power generation).

Denmark-Electricity-Imports-and-Exports-2013

Lately, most of the imported energy has been from Germany (as shown on the diagram at left, which is from the Danish TSO). Coal is the most important source of electricity generation in Germany, accounting for close to half of the generation. In Germany, only ¼ of the generation comes from renewable sources on average. Natural gas and nuclear energy account to close to ¼ of the generation. Thus, electricity imported to Denmark from Germany normally increases the share of fossil fuels and nuclear power in the Danish electricity consumption.

Data centers in Denmark are dependent on fossil fuels and nuclear power

It is highly unlikely that a data centre located in Denmark, connected to the grid.  will be run entirely on clean, renewable energy sources only. For the end-user in Denmark it is impossible to know how the electricity he consumes was generated. Even more important is that Denmark’s electricity mix is dominated by coal power stations.

Denmark-Electricity-Consumption-Mix_1990-2013-and-forecastIn fact every date centre in Denmark can be expected to mostly be run on coal power. Of course companies, including those running data centers, can try to find a generating company that only produces electricity from renewable sources and buy its electricity from that company. But the electricity put into the transmission grid can not be isolated – so to speak – from other electricity on the grid. Therefore, it is of course impossible for the buyer to promise that he is only using or consuming green energy.

It is possible to buy what is called Green Certificates, which are a tradable commodity proving that certain amount of electricity is generated using renewable energy sources only. However, this does not mean that the electricity being consumed by the buyer of the certificate is from renewable sources – it might as well be from a coal power station or from a nuclear plant. The result is that every data center in Denmark, connected to the grid, will in fact be using electricity from all kinds of power plants, including for example coal power stations.

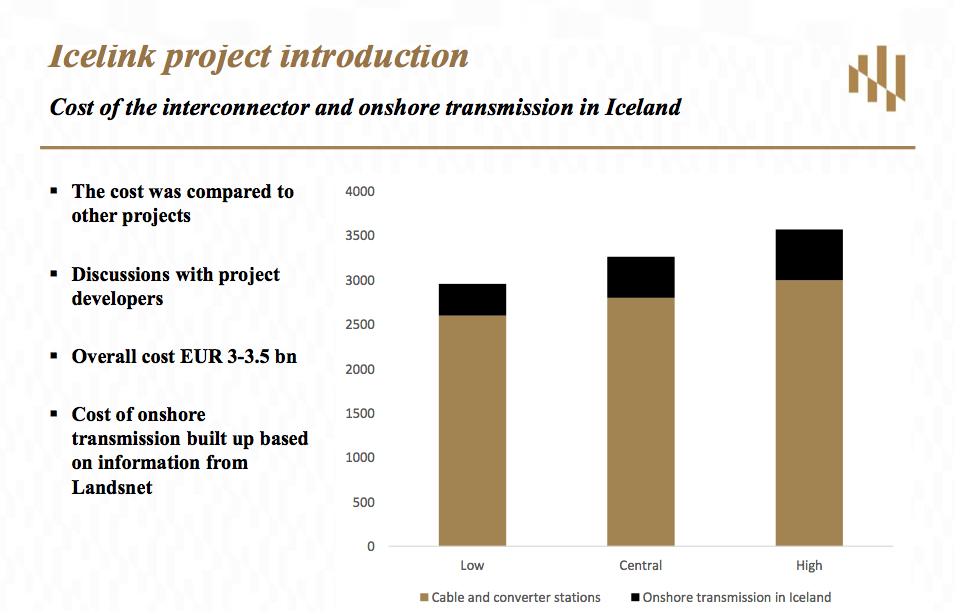
Iceland is the best option for GREEN data centers

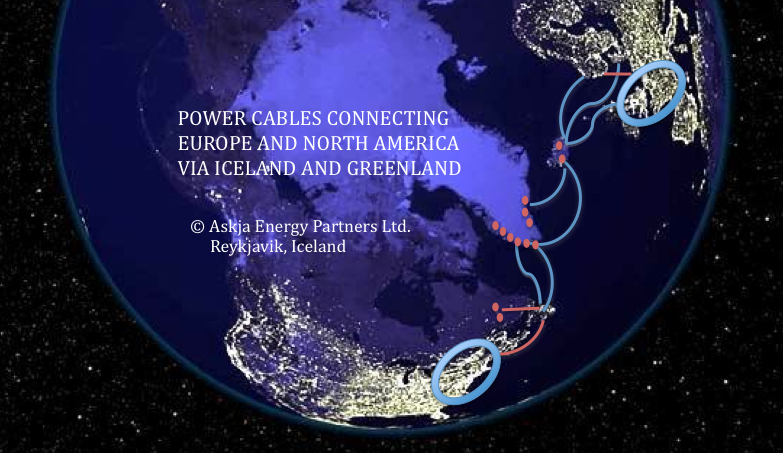
The only way for a major data center being truly able to run on 100 percent renewable energy is to take power from a grid that only delivers electricity from renewable sources. In Europe probably no grid comes as close to this as in Iceland. Iceland produces close to 99.9 percent of its electricity by utilizing hydro- and geothermal power (and some wind power).

Norway is in a similar situation, producing almost all the power from hydro resources. But Norway also imports power from other countries, thus distributing coal power and nuclear power to end-users. So Norway is not quite as green option as Iceland is.

Regarding Denmark, it is obviously not a very green option at all. The environmental accounting may tell us that a company there has a very low net carbon footprint, but in reality the electricity is not only from renewable sources at all. If Apple or any other firm in Denmark wants to run 100 percent on renewable energy it would in fact either have to disconnect from the grid – or set up its operation in Iceland.
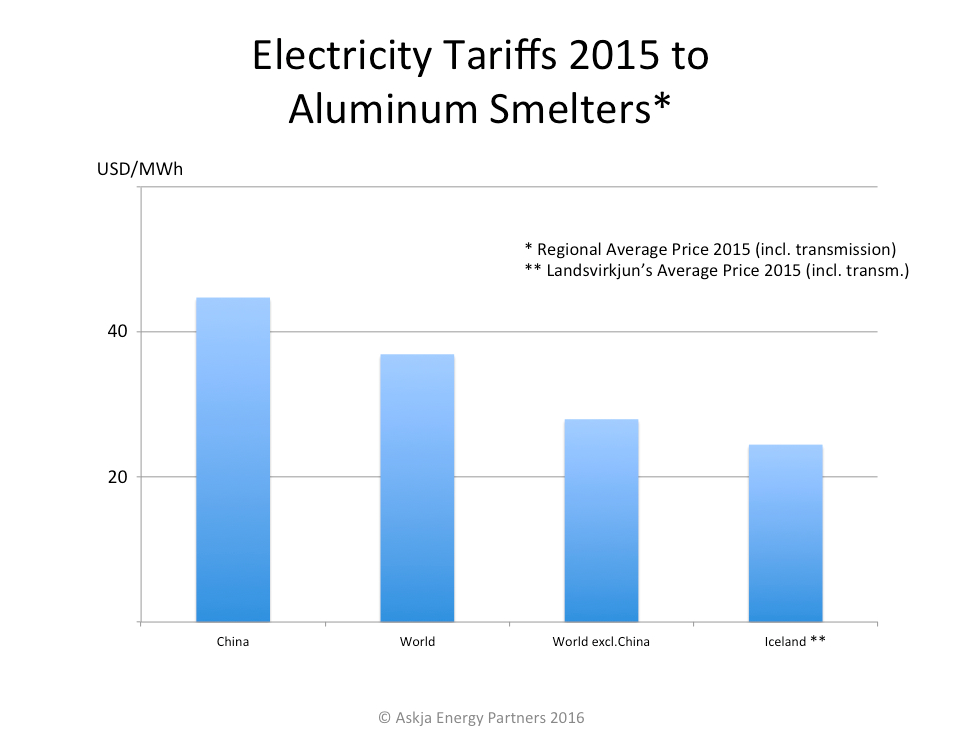
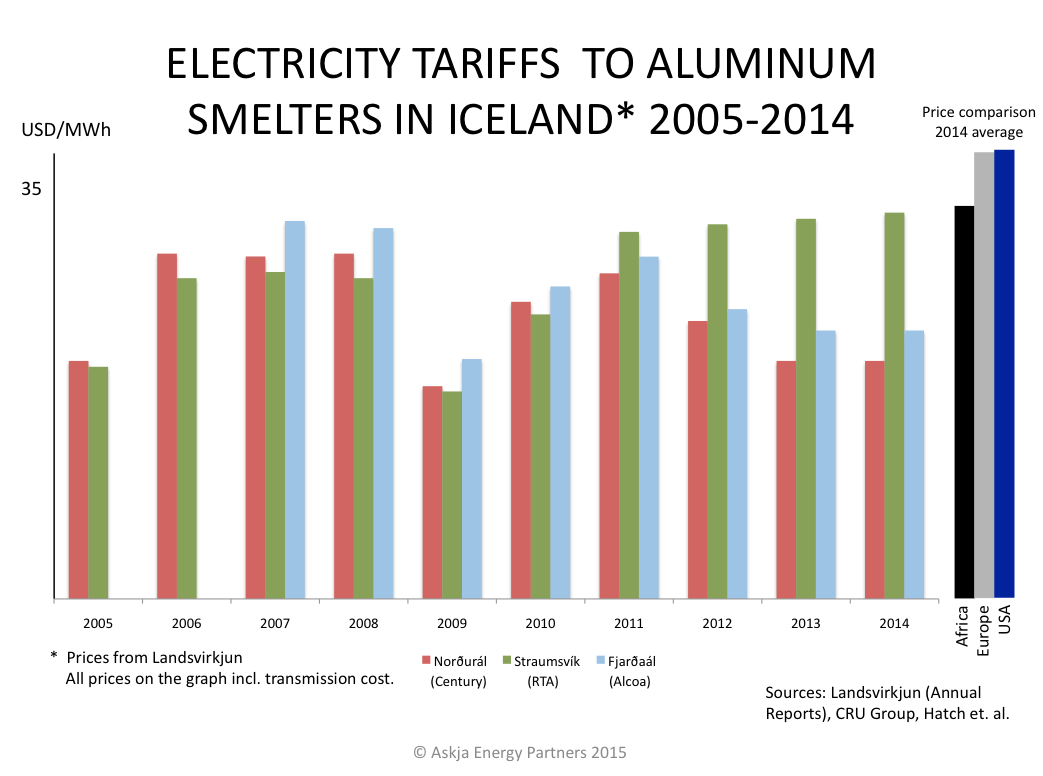
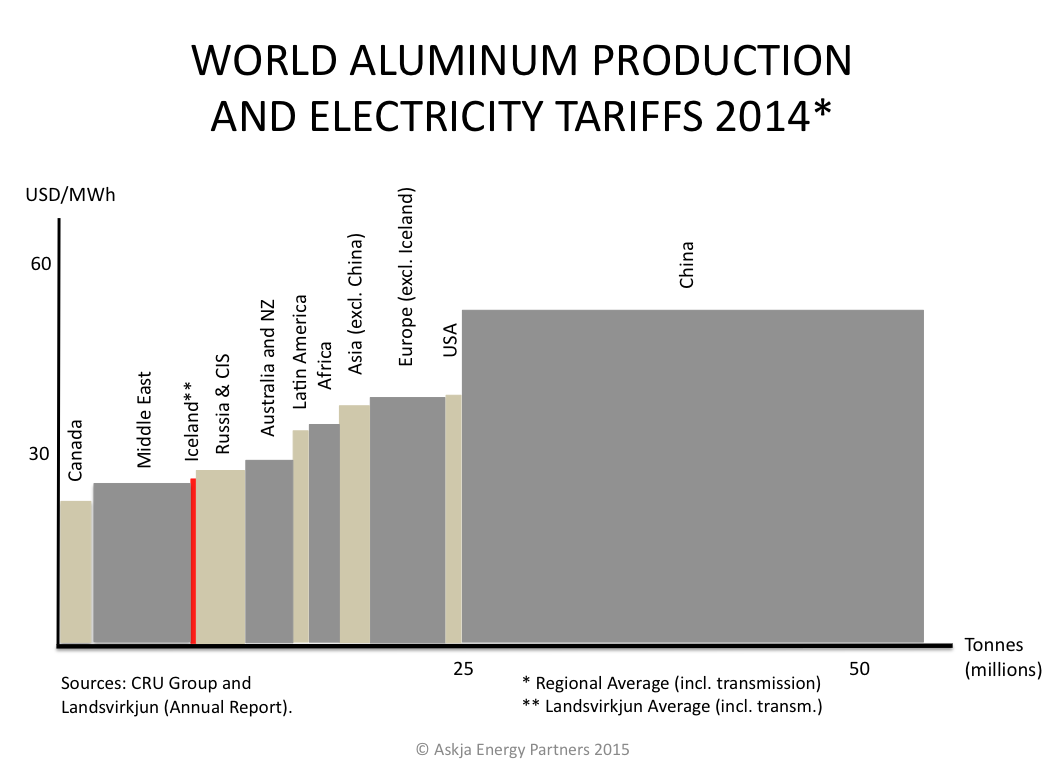
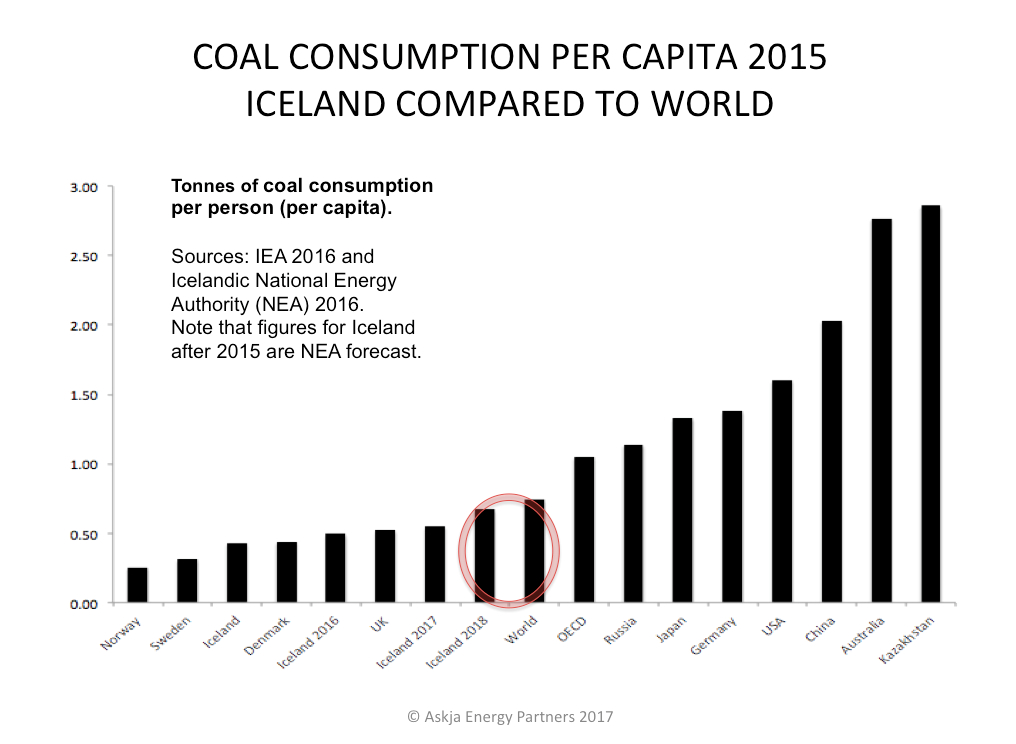
%d bloggers like this: