Skip to content

Archive for

UK-Iceland power cable needs 1,459 MW of new capacity

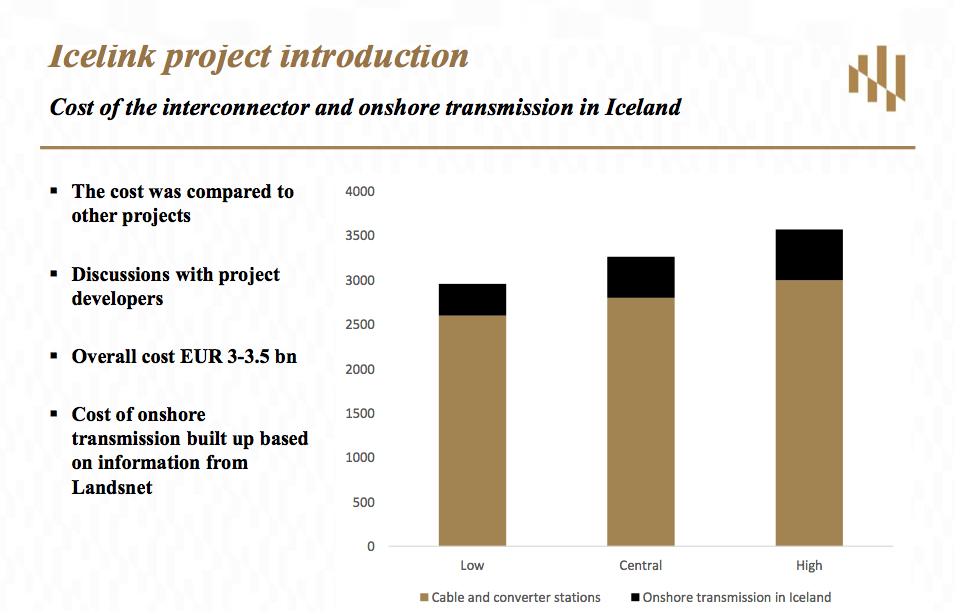
A subsea HVDC power cable between Iceland and the United Kingdom (UK) would call for proportionally extreme increase in Iceland’s generation capacity. According to a new report by Kvika Bank and Pöyry, Iceland needs to build new power capacity of 2,137 MW to supply both the cable and the domestic demand. The figure for the necessary new capacity for the cable only is expected to be 1.459 MW (as shown on the table below). The rest of the new capacity is to meet expected increase in domestic demand for electricity (until 2035).

IceLink-Kvika-Poyry_New-Capacity_Askja-Energy-Partners-Twitter_July-2016The cable is normally referred to as IceLink. The report by Kvika and Pöyry (available in Icelandic only) claims that high proportion of the needed new capacity for IceLink can be met with wind power (today Iceland has very small wind power industry, as new geothermal- and hydropower projects have been the least costly way to generate electricity in Iceland). The authors of the report expect that 550 MW of new wind power would be constructed to meet demand by the cable.

The second largest increase in Icelandic power capacity would be in the form of hydropower refurbishments (which would probably mostly be new turbines in current hydropower stations). This figure is expected to be 448 MW. However, the report does not explain in a clear manner how these refurbishments would be carried out. From the report it is also somewhat unclear why it is believed that 550 MW of new wind power will be a good opportunity for the business case – instead of for example somewhat less wind power and somewhat more hydropower.

Iceland-Small-Hydro-Power-Bruarvirkjun-Project_9-MW
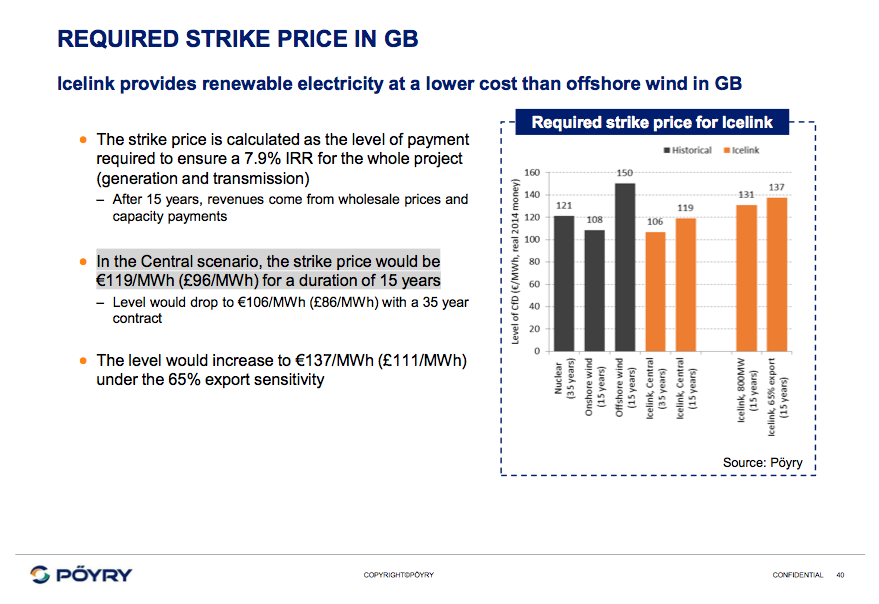
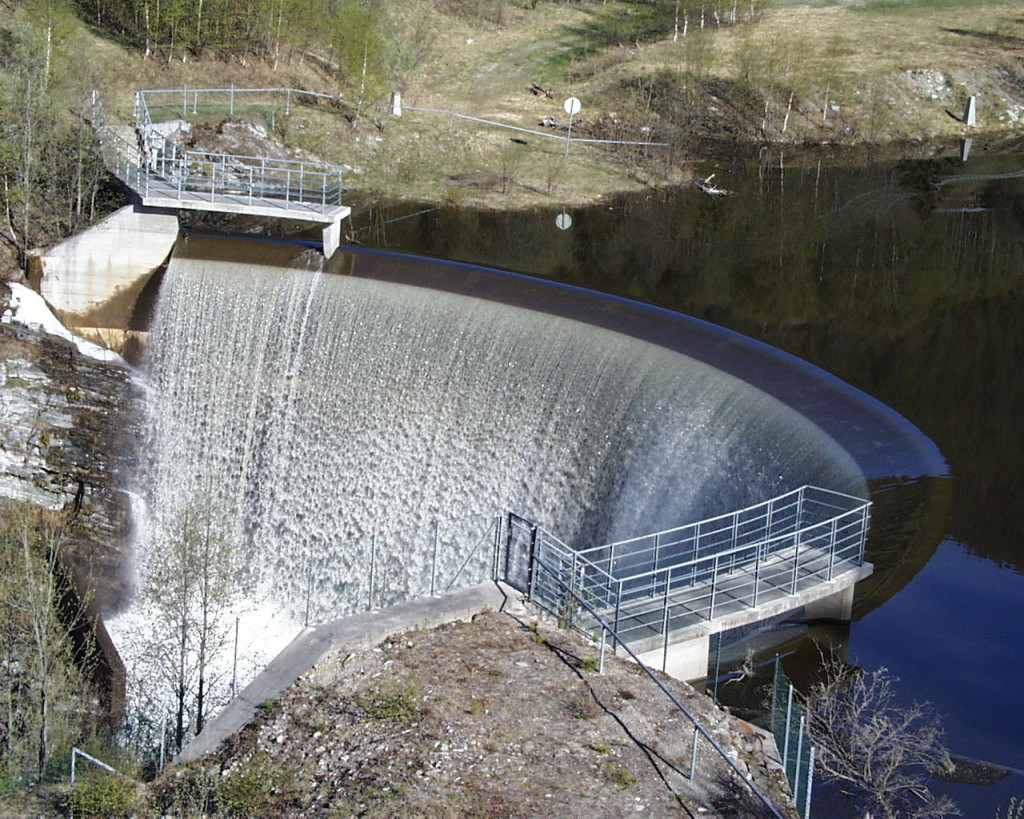
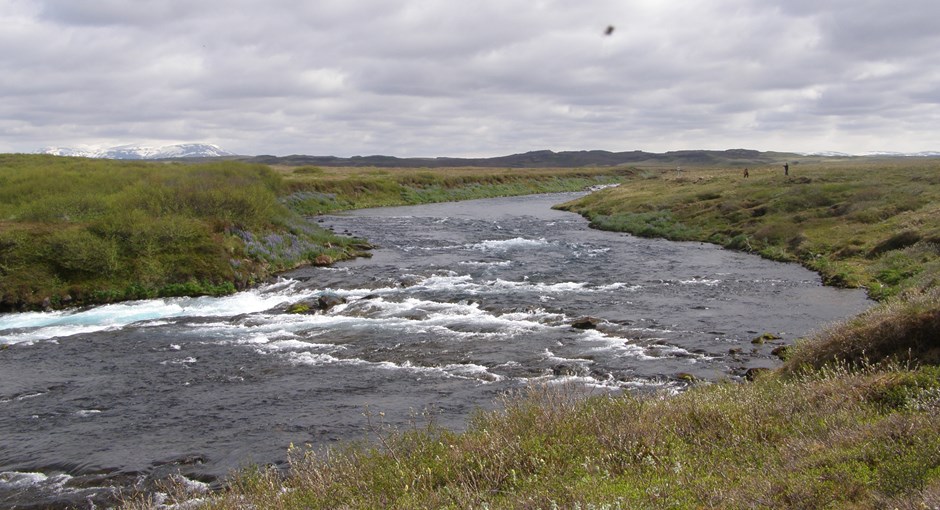
Substantial part of the expected new Icelandic capacity until 2035 would come from new small hydropower stations. Such new small hydropower stations, each with a capacity less than 10 MW, would in total be close to 150 MW. This would probably mean dozens of new small running-river hydropower projects in Iceland. Such projects tend to be more costly than the traditional large Icelandic hydropower projects. However, high strike price for the electricity make such expensive projects financially viable, according to the report.

According to the report, 276 MW of new traditional hydro- and geothermal power will be needed to meet demand from the cable. Most of this capacity will be in geothermal (245 MW).

IceLink-Kvika-Poyry_New-Capacity-and-Generation_Askja-Energy-Partners-Twitter-_July-2016-2
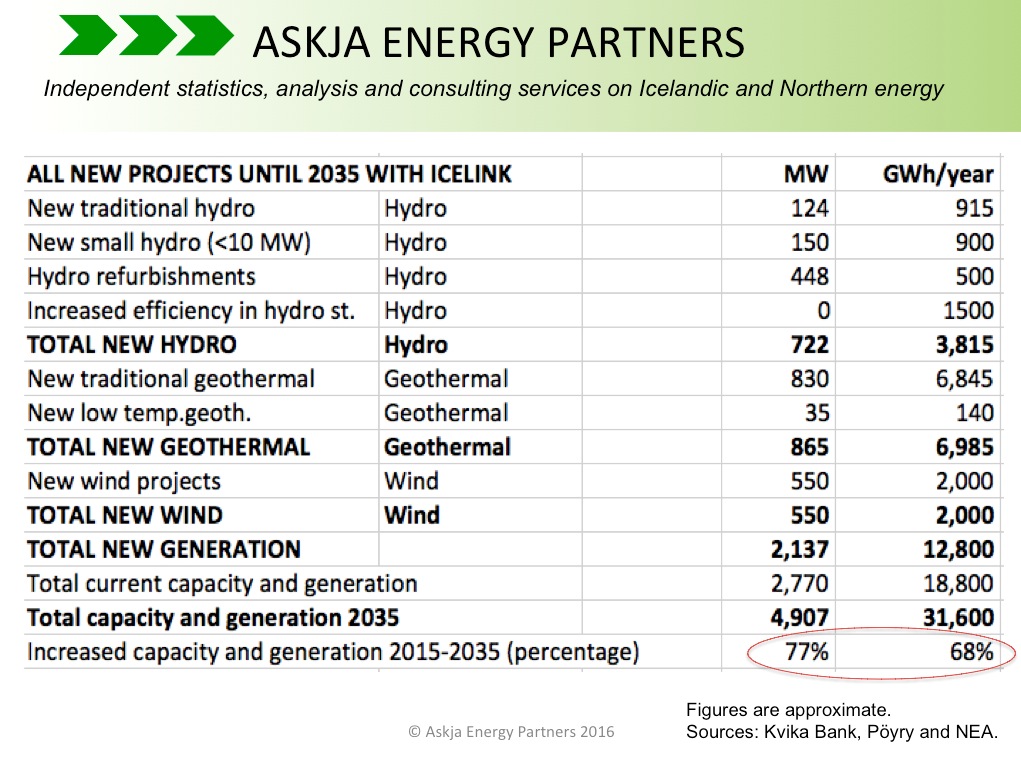
When also taking increased domestic power demand into account, the total new traditional hydro- and geothermal capacity needed by 2035 is expected to be 954 MW; 124 MW in traditional large hydropower and 830 MW in traditional geothermal power. Today, Iceland has 665 MW of geothermal power (and 1,986 MW of hydropower). So the expected increase in utilization of Icelandic geothermal power is quite enormous. It should be noted that figures on traditional hydro- and geothermal power projects in the report are based on the Icelandic Master Plan for Nature Protection and Energy Utilization.

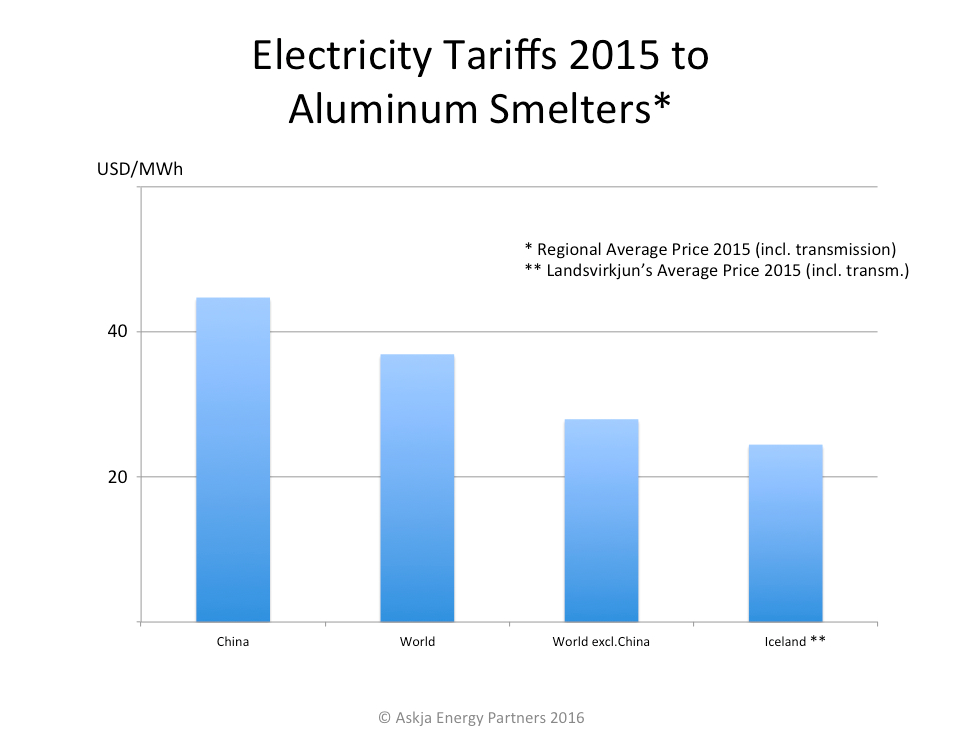
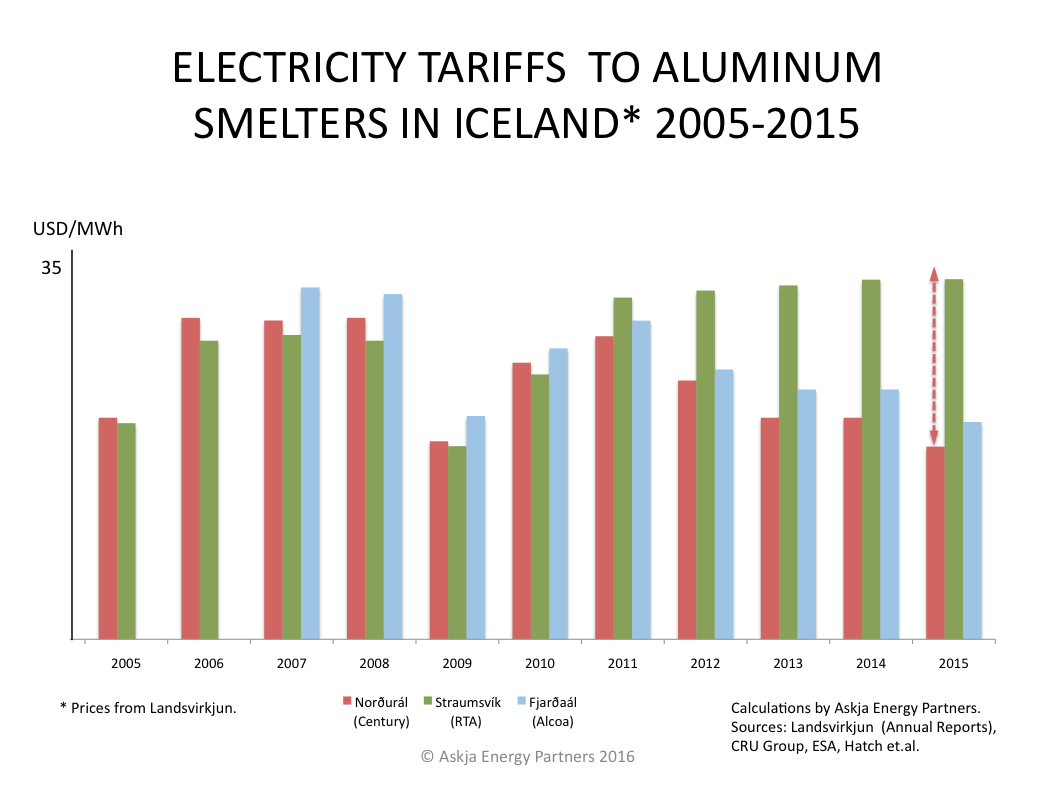
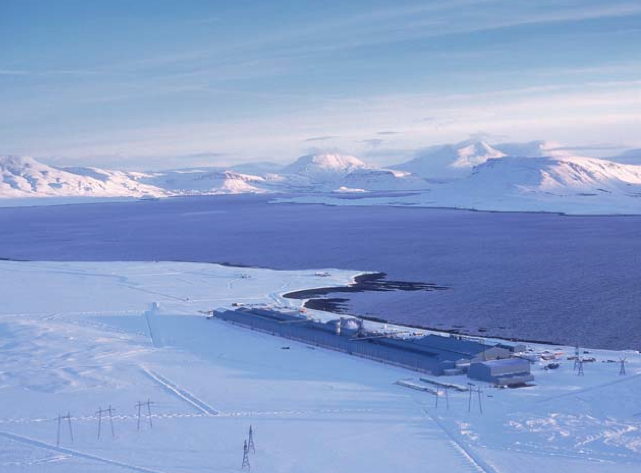
According to the report, considerable part of the new Icelandic power capacity to be developed is to meet expected increased demand from heavy industries in Iceland. Today, heavy industries in Iceland (which are mostly aluminum smelters) consume close to 80% of all electricity generated in the country. According to the report by Kvika Bank and Pöyry on IceLink, all the three aluminum smelters in Iceland will continue their operations in the coming years and decades. And the authors of the report expect that in the coming years and decades power demand of heavy industries in Iceland will increase. It is noteworthy that such assumptions could change dramatically, if for example one of the aluminum smelters in Iceland would close down.

Iceland-Geothermal-Theistareykir-area
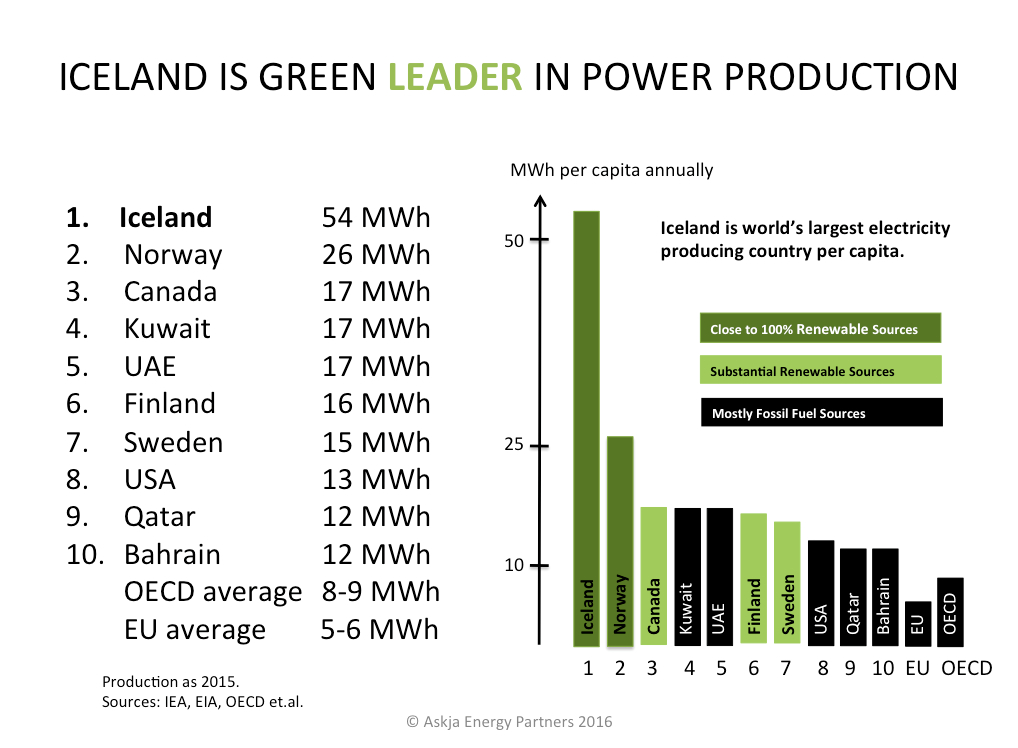
Finally we should mention that if/when IceLink will be constructed, it is expected that the total increased power capacity in Iceland will be around 77% (increase from beginning of 2016). The increase in generation will be somewhat more or close to 68%. According to the above mentioned report, all the projects to meet this increase will be developed in the next 15-20 years. We will soon be revisiting this subject, explaining in more details what power projects will be needed to meet this high increase. Obviously such an increase will/would make Iceland’s position as the world’s largest electricity producer even more pronounced.

Cost of IceLink power cable: 2.8 billion EUR

According to a new report by Kvika Bank and Pöyry, prepared for the Icelandic Ministry of industries and Innovation, a subsea power cable between Iceland and the United Kingdom (UK) will cost EUR 2.8 billion (USD 3.1 billion).

HVDC-Icelink_Cost_Feb-2016-3This central cost scenario includes the 1,200 km long cable with a capacity of 1,000 MW, and the converter stations at both ends of the cable. When adding the onshore transmission installations needed in Iceland for connecting the cable to the power system, the total cost (central scenario) will be close to EUR 3.5 billion (USD 3.9 billion).

The report and additional material on the IceLink-interconnector can be downloaded from the Ministry’s website (the report is in Icelandic only). Note that all cost figures quoted in this article refer to the report’s central export scenario (there are several other scenarios, including a smaller cable of 800 MW).

To realize the project, it will be necessary for the British government to make a commitment of a minimum strike price of approximately 96-99 GBP/MWh (close to 130 USD/MWh).

HVDC-Icelink_strike-prices_Feb-2016-2Such a strike price would be quite similar to the strike price for new nuclear energy in the UK (as explained on the website of the UK government). And it would be substantially lower than recently agreed strike prices for new offshore wind power.

Now it has to be seen if the UK government wishes to pay GBP 115-120 for megawatt-hour of offshore wind power generated in British waters, or pay GBP 96-99 GBP for Icelandic renewable energy.

It should be noted that most of Iceland’s generation is and will be produced by hydropower and geothermal power (wind power in Iceland will increase but still be fairly small share of the total generation). This offers IceLink the possibility of much more flexibility than new British offshore wind power does. We, here at Askja Energy Partners, will soon be explaining further how the Icelandic power for IceLink will be generated.  Stay tuned!

Iceland is the greenest energy country in Europe

EU-EFTA-Renewable-Share-in-Gross-Energy-Consmuption_Askja-Energy-Partners-2016Probably not many of our readers are aware of the interesting fact that apart from the Scandinavian countries, Latvia is the greenest energy country in the European Union (EU). Only Sweden and Finland have a larger share of green energy in their gross energy consumption. However, the two greenest energy countries in Europe are Iceland and Norway (who are not members of the EU, but members of the European Free Trade Association; EFTA).

On the graph above you can see the share of renewable energy (percentage) in gross final energy consumption of each country within the EU and EFTA (the bars show the top-20 countries).

Iceland and Norway are clearly the leaders, with 77% and 69% renewable energy share respectively (in gross energy consumption). Having in  mind that no country in the world generates as much green power per capita as Iceland, it is not surprising that Iceland has the highest share of renewable energy in the gross energy consumption of all the states within EU and EFTA (with regard to energy consumption, Iceland is actually the greenest of all countries in the world).

Have in mind that the average share of renewable energy in the gross energy consumption of all the countries within the EU is currently close to 16%. And EU has the official and binding goal of increasing this share to 20% no later than 2020.

Europe-Renewable-Share-in-Gross-Energy-Consmuption_Askja-Energy-Partners-2016It is also worth noting that there are European countries outside of EU and EFTA that have very high share of renewable energy in their gross consumption mix (as can be seen on the graph at left). This especially applies to Albania (31%) and Montenegro (37%), which puts these countries in 6th and 8th place respectively (on the European list).

It is also interesting how extremely low the share of renewable energy is in Russia’s gross energy consumption (even hough Russia is the world’s fifth largest hydropower producing country). Also note how low the share of renewable energy is in countries like the UK and Holland. They need to do much better! Finally, note that not all European countries are included on the graph (countries that are not included in the data published by Eurostat, apart from Russia).

Main sources:
Eurostat – Information about consumption of energy
Eurostat – Share of renewable energy in gross final energy consumption
Eurostat – Energy from renewable sources (table 1).

European countries not included on the list above:
Andorra, Armenia, Azerbaijan, Belarus, Bosnia and Herzegovina, Georgia, Kazakhstan, Lichtenstein, Moldova, Monaco, San Marino, Ukraine, and the Vatican.

Oil prices must rise… some day

In last February we published an article explaining that the then very low oil price (31-32 USD/barrel) were not sustainable. In the article we focused on why oil prices will soon need to be approaching 60 USD/barrel and then head towards approximately 80-90 USD/barrel.

Oil-Supply-Demand-IEA__2016-2017_June-2016Now, only five months later, the price of oil is close to 50 USD/barrel. This does not mean that higher oil price is here to stay, nor does it mean that a price close to 80-90 USD/barrel is just around the corner. The world is still experiencing quite higher crude oil supply than consumption (demand), which can also be described as over-supply of crude oil. This means that oil price may stay quite low for some time (and even become lower than it currently is). But looking a bit further ahead, the price of oil will need to be approaching 60 USD/barrel and then head towards 80-90 USD/barrel. Else, there will not be enough oil for the world.

The graph above is from IEA’s June report, predicting that oil supply and demand is heading fast towards balance, supply to be outstripped by demand in the second half of 2017. Although this prediction by the IEA may be somewhat optimistic, i.e. it may take longer time for reaching balance in the oil market, it is obvious that in the long run the over-supply will vain. And then we will eventually again experience substantially higher price for crude oil than we have today.

Oil_Global-Liquids-Supply-Cost-Curve-Explained_Askja-Energy-Partners_June-2016To explain this further, we have updated our chart (at left) explaining the cost of future’s oil production. The graph shows where the world’s oil will come from in 2025 and at what cost.

In 2025 very substantial amount of the world’s oil will come from currently producing oil fields. However, due to decline in those oil fields and due to growing oil consumption, we will also need oil from new fields (which have already been discovered and are being developed). And to be able to bring those fields in production, we will need quite high oil price.

Large share of the oil consumed in 2025 will be coming to the market even if the oil price will only be in the range of 60-80 USD/barrel. But if we are hoping to avoid oil supply crisis, the oil price needs to become even higher. Like close to 90 USD.

To ensure all this oil will be brought up from the ground, we will need substantially higher oil price than we have today. Thus, it is likely that within the next decade we will see the price of oil approach 90 USD/barrel (in present USD value).

Bogle-Vanguard-Nobody-knows-nothingOf course the oil price may in some periods become higher and sometimes it will be lower. And keep in mind that it is impossible to predict with any precision how oil consumption (oil demand) will develop in the world (the same applies to prediction for renewable energy growth). No one knows what the price of the black gold will be at a certain point of time in the future (remember the wise advice Jack Bogle received early in his carrier!). However, if the world economy is going to keep on growing, like we are used to, we will need crude oil.  And a lot of it. A decade from now it is unlikely we will have all that oil unless we are willing and able to cover a production cost of at least approximately 90 USD/barrel.

The unknowns are many and the oil markets are extremely sensitive to all kinds of events. We don’t know how the economy in Asia will grow in the coming decade. And we don’t know if we are soon to experience enormous growth in new types of vehicles, using electricity instead of fossil fuels.

BNEF-EV-Sales-Prediction-2016If the 2020’s will be the decade of the electric car, as Bloomberg New Energy Finance (BNEF) now predicts, oil demand may become a lot slower than the oil companies are assuming. Which could result in continued over-supply of oil. So it is to be seen how growing production – and lower costs – of EV’s, will affect investment decisions by the oil companies. Stay tuned!

Iceland is green leader in power production

For the last ten years, Iceland has been the world’s largest electricity producer per capita. The Icelandic generation is much higher (per capita) than in any other country. Norway comes in second place, generating close to half of the electricity per capita of that of Iceland. The Icelandic annual generation is close to 54 MWh per capita, while Norway generates close to 26 MWh per capita.

Iceland-Green-Power-Electricity-Production-Per-Capita-Comparison-2015_Askja-Energy-Partners-2016Other countries on the top-ten list of the world’s largest electricity producers per capita are Canada, Kuwait, United Arab Emirates (UAE), Finland, Sweden, United States of America (USA), Qatar and Bahrain.

Most of the countries on the top-ten list of the world’s highest electricity producing countries per capita generate most or all their electricity from fossil fuels (gas and coal). However, both Iceland and Norway produce close to 100% of their electricity from renewable sources (both countries draw from hydroelectric power, but Iceland has a unique energy source in its geothermal power).

Canada, Finland and Sweden all have extensive hydropower sources and utilize them for electricity generation. Thus, they might be described as semi renewable electric producers (thus marked with light green color on the graph, whereas Iceland and Norway are marked with dark green).

Electricity statistics update 2015

The Icelandic National Energy Authority (NEA) has published statistics regarding the electricity industry in 2015. You can access the publication in Icelandic on NEA’s website (link to the pdf-file). Here are some of the key numbers:

———————————————————————————————————————————————————– 

TOTAL ELECTRICITY GENERATION:          18,798 GWh (2015)

———————————————————————————————————————————————————– 

ELECTRICITY GENERATION SHARE BY SOURCE:

Hydro Power 13,780 GWh          73%
Geothermal Power     5,003 GWh         27%
Other 15 GWh            0%
Total 18,798 GWh        100%

NB: 2015 is the third year the NEA publishes data for generated wind power in Iceland. Electricity generated by wind power (11 GWh) and fossil fuels (4 GWh) was to small amount to be measured as a percentage on the scale of the table above. The combined wind- and fossil fuels generation amounted to 15 GWh, which was less than 0.001% of all electricity generated in Iceland in 2015.

———————————————————————————————————————————————————– 

ELECTRICITY POWER CAPACITY:  

Hydro Power  1,986 MW
Geothermal Power     665 MW
Wind Power         3 MW
Fossil Fuels     117 MW
Total Power Capacity 2,771 MW

———————————————————————————————————————————————————– 

ELECTRICITY CONSUMPTION SHARE:

Energy Intensive Industries 77%
General Consumption     18%
Other (losses)     5%
Total 100%

——————————————————————————————————————————————————

You will find more Icelandic energy data in our special data-section.

Low aluminum price resulted in lower power tariffs

Power tariffs to aluminum smelters in Iceland are among the lowest in the world.

Power-Tariffs-to-Aluminum-Smelters-in-World-China-and-Iceland-2016Due to low aluminum price in 2015, electricity price to aluminum smelters declined in most parts of the world during 2015. The world average smelter power tariff fell by 12% in 2015, according to CRU Group. This drop can primarily be attributed to a 15% drop in China’s average power tariff. The average power tariff in the World excluding China also fell in 2015, decreasing by 8.2%.

The average power tariff to smelters in Iceland also declined in 2015, although the decline was less than in some other areas of the world. The result was that during 2015, the average electricity price from Icelandic power company Landsvirkjun to the aluminum smelters in Iceland, was approximately 2/3 of the world average tariff to such smelters.

Viking Link ready in 2022?

We already have subsea HVDC power cables being constructed between Norway and the United Kingdom (UK) and between Norway and Germany. These cables will be 700 km and 570 km, respectively. And now one more major connector if this kind is planned in the area, between UK and Denmark. That cable is referred to as Viking Link, will be 650 km long.

HVDC-Viking-Link-Uk-Denmark-MapViking Link is expected to have a capacity of up to 1,400 MW. Recently, the Danish Transmission System Operator Energinet and the UK National Grid decided to launch a tendering process for the examination of the seabed between the two countries. Both companies have expressed their strong believe in the positive effects of such a power connection, which will open up possibilities to harness more wind energy at competitive prices. The successful tenderer will carry out geophysical surveys and sampling to pinpoint areas of environmental and archaeological interest and help identify the best route for the marine cables and suitable landing locations.

For the UK, the main advantage of Viking Link would be in the access to more power, at the same time as that power will mostly be generated by harnessing renewable sources. For Denmark, the cable will open access to much larger market for Danish wind power. The plan is to take the final investment decision no later than in 2018. The cable could then become operational about four years later or 2022.

Unique opportunity for Statkraft

Norwegian state-owned power company Statkraft is by far the largest power producer in Norway. The company produces almost all the electricity by hydropower plants, often at a very low cost.

Statkraft-long-term-contracts-2015Large share of the electricity Statkraft is selling today, is produced to fulfill long-term contracts with heavy industries, such as aluminum smelters in Norway. The tariffs for most of this power are very low; in general substantially lower than the electricity price on the spot market of Nord Pool Spot. In the coming years, most of these contracts will run out, creating a great opportunity for Statkraft to increase its revenues and profits.

Today, close to 20 TWh of Statkraft’s production are sold by long-term contracts. This is approximately 40% of all the electricity Statkraft generates by hydropower stations in Norway and other Scandinavian countries (Statkraft has significant operations outside of Norway, particularly in Sweden). Within a few years, Statkraft will be able to put up to 15 TWh of extra electricity into the spot-market.

Norway-Statkraft-Vannkraft-NorgeWith the construction of the NSN Interconnector (or North Sea Link) and NordLink, Norway will soon have stronger transmission-links with Britain and Germany. These HVDC cables will have a combined capacity of 2.800 MW. This  access to the higher priced European spot markets will open up the possibility for increased revenues for Norwegian-made green electricity.

Although it is possible, and even likely, that some of the long-term power contracts of Statkraft may be re-negotiated, the new cables and expired contracts will create unique opportunities for Statkraft. Making Norway’s position as a giant green power battery even stronger. This is a path that other countries with extensive hydropower resources may follow, making Northern renewable energy even more profitable than it presently is.

Decreased revenues pr. MWh from smelters in 2015

Last year (2015), the price of aluminum dropped from what it was the previous year (2014). Iceland has three aluminum smelters and Landsvirkjun (the National Power Company) generates great amounts of electricity to these smelters.

One of the three smelters, Rio Tinto Alcan (RTA) in Straumsvik or ÍSAL, pays fixed power price (the tariff is linked to US Consumer Price Index; CPI). This contract between RTA and Landsvirkjun was made in 2010, with additions in 2014. The other two smelters have power contracts based on a different model, where the tariffs are linked to the price of aluminum (as the aluminum price is at the London Metal Exchange). These two contracts are from 1999 and 2003 respectively. The contract from 1999 is with the Norðurál smelter of Century Aluminum at Grundartangi, and the contract from 2003 is with the Fjarðaál smelter of Alcoa on Reyðarfjörður.

Electricity-Tariffs-to-Aluminum-Smelters-in-Iceland_2005-2015-and-likely-price-increase-to-Nordural-Century-2019_Askja-Energy-Partners-2016Because of the two contracts having the tariffs linked to aluminum price, revenues of Landsvirkjun pr. each sold MWh to the smelters in 2015 were lower than in 2014.  The graph at left shows how the power price paid by each of the three smelters developed in the period of 2005-2015. Each bar shows the average price of electricity each year, with regard to each smelter. Note that transmission cost is included in the tariffs (the average transmission cost is close to 6 USD/MWh). Landsvirkjun then forwards the transmission payment to the Icelandic TSO; Landsnet.

As can clearly be seen from the graph, the smelter of Norðurál (Century Aluminum) pays the lowest tariff. The smelter of Fjarpaál (Alcoa) pays a slightly higher tariff than Norðurál. The smelter at Straumsvík (Rio Tinto Alcan) has the most recent contract and is currently paying the highest tariff of all the three smelters.

Aluminum-Smelter-in-Iceland-WinterObviously, Landsvirkjun is taking substantial risk when it agrees on having the tariffs linked to aluminum price. At the same time the low tariffs, linked with aluminum price, make the Icelandic smelters of Alcoa and Century Aluminum almost financially risk-free operations. Century has come close to acknowledging this, by stating that its Grundartangi smelter in Iceland “generates significant free cash flow in virtually all price environments”.

Currently, a new power contract of Landsvirkjun and Century Aluminum is being negotiated (the old contract from 1999 runs out in 2019). It seems likely that Landsvirkjun will offer Century a similar deal as Rio Tinto Alcan got in 2010. Which means that from 2019, we may expect that Century’s Icelandic smelter at Grundartangi in Southwestern Iceland, will be paying close to 34 USD/MWh (in todays value), as marked with a red arrow on the graph above. However, it might be a better deal for Landsvirkjun and its owner (which is the Icelandic State) to sell the power to Europe via HVDC cable. With regard to this, it should be noted that the governments of Britain and Iceland are now in discussions on the possibility of such a cable.

NB: Power tariffs to the three smelters are estimated by Askja Energy Partners, with regard to annual reports of Landsvirkjun and several other information as published by CRU Group, EFTA Surveillance Authority, et al.