Skip to content

Posts from the ‘Energy Data’ Category

EIA: Iceland tops Europe’s no-carbon list

Europe-No-Carbon-Electricity-Generation-EIA-2012-1Countries of Europe are increasing electricity generation using no-carbon sources. According to the US Energy Information Administration, Iceland is at the top of the list of no-carbon electricity generation countries in Europe. Electricity generation in Iceland is 100% from no-carbon hydro- and geothermal power sources, and the country is completely self-sufficient in electricity supply.

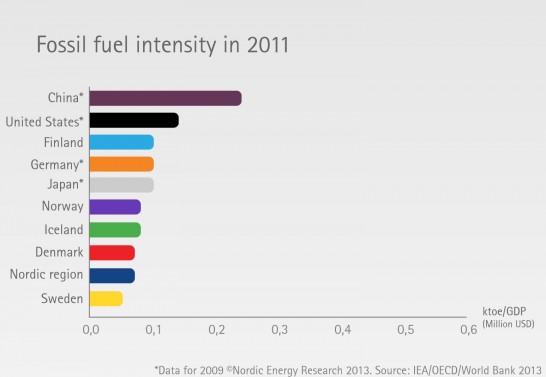
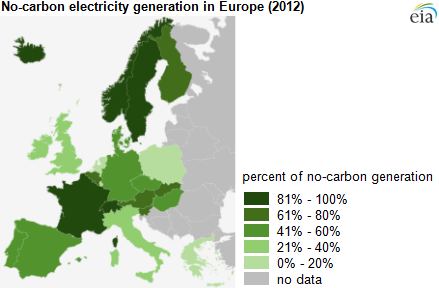
Only France, Iceland, Norway, Sweden, and Switzerland generate more than 90% of their net electricity from no-carbon sources (data from 2012). Only in Iceland and Norway this number of no-carbon electricity sources was 100%.

Eight other countries had no-carbon electricity accounting for at least 50% of their generation. Countries in Europe generate most of their no-carbon electricity from nuclear and hydroelectric sources, along with a smaller portfolio of other renewables.  No-carbon sources generate power while releasing virtually no carbon dioxide emissions. This includes geothermal, hydroelectric, nuclear, solar (both utility scale and distributed solar), tidal, and wind generation (although biomass power plants emit carbon dioxide during operation, the full life cycle of biomass fuels is often considered to be carbon neutral for the purposes of satisfying these countries’ goals).

Europe-No-Carbon-Electricity-Generation-EIA-2012-2 Penetration rates of no-carbon generation have increased from 50% to 56% in recent years in Europe, as European Union countries (EU) work toward renewable energy and greenhouse gas emissions targets. The share of no-carbon generation in European countries is expected to continue to increase, as the EU’s 2020 Climate and Energy Package targets both a decrease in greenhouse gas emissions and an increase in the share of energy consumption generated from renewable sources.

Main source: US Energy Information Administration.

Electricity statistics update 2013

The Icelandic National Energy Authority (NEA) has published statistics regarding the electricity industry in 2013. The publication is in Icelandic only (link to the pdf-file). Here are some of the key numbers:

————————————————————————————————————————————————————–

TOTAL ELECTRICITY GENERATION:          18,116 GWh (2013)

————————————————————————————————————————————————————–

ELECTRICITY GENERATION SHARE BY SOURCE:

Hydro Power 71%
Geothermal Power     29%
Other     0%
Total 100%

NB: Electricity generated by wind power and fossil fuels was to small amount to be measured on the scale of this table. This is the first year the NEA publishes data for generated wind power in Iceland (it was 5 GWh which is less than 0.001% of all electricity in Iceland in 2013).

————————————————————————————————————————————————————–

ELECTRICITY POWER CAPACITY:


Hydro Power  1,986 MW
Geothermal Power     665 MW
Wind Power         2 MW
Fossil Fuels     114 MW
Total Power Capacity 2,767 MW

————————————————————————————————————————————————————–

ELECTRICITY CONSUMPTION SHARE:

Energy Intensive Industries 80%
General Consumption     18%
Other     2%
Total 100.00%

————————————————————————————————————————————————————–

You will find more Icelandic energy data in our special data-section.

Aluminum and Icelandic GDP

According to recent research at the University of Iceland, direct contribution of the aluminum industry in Iceland has been around 2.9 percent of gross domestic production (GDP). This is the average percentage for the period 2007-2010. In this period, the contribution reached its maximum in the year of 2010, when it was 4.6% of GDP.

Anna-Gudrun-Ragnardottir

In her theses towards a MS degree in Economics at the University, Ms. Anna Guðrún Ragnarsdóttir describes how the aluminium industry has had a major influence on Iceland’s economy. The author explains how the aluminum industry can be divided into three different categories, regarding its contribution to the Icelandic GDP; direct contribution, indirect contribution and demand effects. The industry’s total contribution to the Icelandic GDP was calculated as the sum of direct and indirect contribution. The demand effects were not estimated in the thesis.

The direct contribution of the aluminum industry is estimated using a data set from Statistics Iceland. Estimating the industry’s indirect contribution was more complex. The aluminum sector now consumes almost 75 per cent of electricity generated in Iceland. When taking this part of the Icelandic energy industry into account, the total contribution of the aluminum industry to the Icelandic GDP is somewhat larger than the direct contribution, and the total contribution can be said to be 5.4-6.3 per cent annually (on average in the period 2007-2010). In 2010 this number was approximately 7.7-8.6 per cent.

Straumsvik-nature-aluminumum-smelter

In her thesis, Ms. Ragnarsdóttir explains how aluminum production first began in Iceland in the year 1969, with an output of barely 11 thousand tons annually. In the early 1990s the rate of production grew rapidly and today it is around 820 thousand tons annually. Two of the largest hydroelectric power stations in Iceland were constructed mainly to serve the aluminium industry. According to the thesis, the industry generates in total around 4,000 jobs in the country. However, almost all the aluminum products manufactured in Iceland are exported. Today, the aluminum products have approximately a 40 percent  share in the total export of goods from Iceland (which is more or less the same proportion as that of fish products).

Icelandic emissions are mostly from transport

Nordic-Greenhouse-Gas-Emissions-Per-Capita-compared-2010

The countries of the Nordic region (Denmark, Finland, Iceland, Norway and Sweden) have much lower Greenhouse Gas (GHG) emissions per capita than some other Western countries. However, the Nordic countries have higher GHG-emissions than many other industrialized countries in Europe.

One of the main reason behind somewhat high emissions in the Northern countries, is the extensive energy-intensive industry in some of them. Finland and Sweden have a large  paper- and pulp industry, and Norway and Iceland have extensive aluminum industry (resulting from historical low power cost, from utilization of hydropower).

In Iceland, emissions from generation of electricity and from heating are very low owing to the exclusive use of renewable energy sources (geothermal and hydropower). Still, Iceland’s per capita GHG-emissions are the highest in the Nordic region.

Almost 80 per cent of the GHG-emissions stem from transport and fishing vessels. Process emissions from aluminium production plants have the most significant impact on emissions after transport.

Nordic-Fossil-Fuel-Intensity-2011Fossil-fuel intensity is another interesting measurement. It tells us how much fossil-fuel energy it takes to create one unit of GDP. In this measure, China and the US are relatively fossil fuel intensive. The Nordic countries are well ahead of many other economies in their fossil fuel efficiency due to their high utilization of renewable energy. Iceland has a significantly lower fossil-fuel intensity than energy intensity, reflecting its abundant renewable energy sources, utilized both for electricity generation and heating.

Landsvirkjun becomes wind power operator

Last Thursday, the Icelandic power company Landsvirkjun started the operation of two wind turbines close to the Búrfell Hydropower Station in Southern Iceland. These are the first large wind turbines in Iceland.

Landsvirkjun-Wind-Power-Station-erected-1The wind turbines each have a 900 kW capacity (1.8 MW of installed power in total). Together their generating capacity could be up to 5.4 GWh per year. The masts reach a height of 55 metres and each spade measures 22 metres in length. When the spades are at their highest position the unit will achieve a height of 77 metres.

The wind turbines are produced by the German company Enercon (model Enercon E-44). Enercon specialises in manufacturing direct-drive wind turbines, where the the generator produces electricity with fewer turns and thus reduced mechanical stress, increased engine life and reduced energy loss and noise.

The turbines operate at or around full capacity at wind speeds of 15-28 m/sec. Below 3 m/sec and above 34 m/sec, electricity generation stops. They connect to an 11kV underground electric cable running along a road towards Búrfell Hydropower Station. All additional electricity- and data cables are underground, in order to minimize environmental impact.

Landsvirkjun-Wind-Power-Station-erected

The turbines are located in an area with quite stable winds, with medium wind speed of  10-12 m/sec (stronger in winter than summer) at mast height (55 m). The towers and equipment were erected in last December (2012). Since then, Enercon has carried out and completed necessary tests for the project. Now the project has been handed over to Landvirkjun, and the turbines formally started operating. Their generation can be followed in real time at Landsvirkjun’s website.

There are a number of areas in Iceland that show great potential for the successful utilisation of wind energy. The project is part of Landsvirkjun’s research and development project on the advantageous of wind power in Iceland. The main objective of the project is to obtain operational experience with wind turbines far inland and in the Icelandic climate. Various climatic studies will be carried out during operation, including wind measurements and research on icing, the impact of snow, ash and soil erosion as well as the effects on birds and other wildlife.

Landsvirkjun-Wind-Power-Station-erected-3It is also of nterest, that the Icelandic Meteorological OfficeLandsvirkjun, the Icelandic Icelandic TSO Landsnet and the University of Iceland are all participants in a special research project called Icewind ,supported by the Nordic Top-level Research Initiative and the Nordic wind energy industry. The project objectives, related to offshore wind, include resource mapping near Iceland and improved land-wind resource map such that full-scale studies can be carried out on the integration of hydro- and wind power in Iceland. This may offer new and very economical opportunities to increase renewable electricity generation in Iceland.

Icelandic electricity generation and transmission

The Icelandic electricity generation capacity and production has more than doubled in a decade. Today, the total capacity is 2,669 MW. The annual generation 2011 was 17,210 GWh.

ELECTRICITY GENERATION BY SOURCE:

Hydro Power              1,884 MW            12,507 GWh
Geothermal Power       665 MW              4,701 GWh
Fossil Fuels                   120 MW                      2 GWh
Total                            2,669 MW            17,210 GWh

Slide08Close to 100% of the electricity generation in Iceland is produced by harnessing renewable sources. Hydropower is the largest source with close to 73% of the annual generation. Geothermal accounts for about 27% of the generation. In addition, there are a few fossil fuel generating plants.

Several new power stations are under planning (both hydropower and geothermal power). The most recent one (now being constructed in South Iceland) will become operational in late 2013 .

Slide10The power stations in Iceland are located all around the country. The geothermal power plants (marked by red on the illustration at left) are of course to be found where it is easiest to harness the geothermal heat for electricity generation. All the main hydropower stations utilize glacial water, flowing from Iceland’s glaciers.

The largest hydropower system is the Þjórsá and Tungnaá river system in Southern Iceland (marked by a large blue dot on the map at left) . However, Iceland’s largest power station is in the Northwestern part of the country. This is the 690 MW Fljótsdalur / Kárahnjúkar hydropower plant, that started operating in 2007 (marked on the map by the large blue dot north of Vatnajökull Glacier).

Slide09The total annual Icelandic electricity generation of 17,210 GWh (17 TWh) makes Iceland one of Europe’s largest producers of renewable power.

Norway is in a strong first place with its massive hydropower capacity, generating approximately 120 TWh annually. However, the electricity price in Iceland is much lower than in Norway or other European countries. Iceland  has no electricity connections with other countries. Thus, the generating firms in Iceland do not have access to the large electricity markets in Northwestern Europe, where electricity prices tend to be much higher than in Iceland.

Slide11

Despite Iceland’s isolated electricity market and sometimes severe weather conditions, the electricity supply in Iceland is renown for its reliability (see for example IMD’s and WEF’s World Competitiveness reports). This high reliability is the result of Iceland’s large reservoirs and the solid transmission system, which is operated by the Icelandic Transmission System Operator or TSO (Landsnet). The TSO connects all the large power stations to the Icelandic electrical grid, which runs around the country (all the nation lives in the lowlands, with the majority located in Southwestern Iceland).

Icelandic energy basics

Today, we publish the first post in a special introductory series about the Icelandic energy sector.

This series will include the following seven headings:

–  Icelandic Energy Basics (today)
–  New Low-Cost Renewable Capacity (December 17th)
–  The Icelandic Electricity Generation and Transmission (December 24th)
–  Overview of the Icelandic Energy Business (January 2nd 2013)
–  The Largest Consumers of Electricity in Iceland (January 7th 2013)
–  Future Growth of the Icelandic Energy Industry (January 14th 2013)
–  Gaining from the European Green Drivers (January 21st 2013)

———————————————————————————

WORLD RECORD FOR RENEWABLE ENERGY

Iceland-Electricity-Production-Per-Capita-ComparsionNatural hydro- and geothermal resources have made Iceland the world’s largest green energy producer per capita.

Last year (2011) the electricity industry in Iceland produced 17,210,000 MWh (17.2 TWh) of electricity, which is close to 54 MWh per capita. In comparison, the average electricity production per capita by the countries within the OECD and EU is close to 9 MWh and 6 MWh, respectively.

What makes the Icelandic energy profile even more interesting, is the fact that all the electricity is produced by harnessing renewable sources only. Renewable energy sources (hydro and geothermal) supply almost 100% of Iceland’s consumption of electricity. Furthermore, geothermal district heating provides almost 90% of Iceland’s heating needs.

Iceland-Energy-Independence-Primary-EnergyIn total, approximately 86% of Iceland’s consumption of primary energy comes from renewable sources. Of that total, 20% comes from hydropower- and 66% from geothermal sources. This is the world’s highest share of renewable energy in any national total energy budget.

Although hydropower and geothermal power offer the lowest cost opportunities, Icelandic wind energy may also be harnessed in the near future. The first large wind turbines in Iceland are expected to become operational in 2013.

TOWARDS EVEN STRONGER ENERGY INDEPENDENCE

Iceland-Primary-Energy-Use-History_1940-2010The high share of renewable energy in Iceland’s energy portfolio (86%) is despite the fact that Iceland imports almost all its transport fuel. Today, imported carbon fuels and other oil products account for 14% of the gross energy consumption in Iceland. This number may soon become somewhat lower, as oil exploration is about to start at the continental shelf deep Northwest of Iceland’s shore.

Iceland’s renewable energy sources are not only abundant, relative to the size of the nation as a whole, but they are also available at a comparatively low cost. The cost issue will be discussed further in next week, here at Icelandic Energy Portal. Read more

Electricity statistics update 2012

The Icelandic Energy Authority has published statistics regarding the electricity industry in 2011. The publication is in Icelandic only (link to the pdf-file). Here are some of the key numbers:

————————————————————————————————————————————————————–

TOTAL ELECTRICITY GENERATION:          17,210 GWh (2011)

————————————————————————————————————————————————————–

ELECTRICITY GENERATION SHARE BY SOURCE:

Hydro Power 72.67%
Geothermal Power     27.32%
Fossil Fuels     0.01%
Total 100.00%

————————————————————————————————————————————————————–

ELECTRICITY POWER CAPACITY:

Hydro Power  1,884 MW
Geothermal Power     665 MW
Fossil Fuels     120 MW
Total 2,669 MW

————————————————————————————————————————————————————–

ELECTRICITY CONSUMPTION SHARE:

Energy Intensive Industries 80%
General Consumption     18%
Other     2%
Total 100.00%

————————————————————————————————————————————————————–

We will soon be offering more Icelandic energy data in our special data-section.

World’s largest electricity producer per capita

Iceland is the world’s largest electricity producer per capita. Norway comes in second place, by generating approximately half the electricity per capita of that of Iceland.

Other countries on the top-ten list of the world’s largest electricity producers per capita are Canada, Qatar, Kuwait, Finland, Sweden, United States of America (USA), United Arab Emirates (UAE) and Bahrain.

Most of the countries on the top-ten list of the world’s highest electricity producing countries per capita generate most or all their electricity from fossil fuels, especially gas and coal. However, both Iceland and Norway produce close to 100% of their electricity from renewable sources (both countries draw from hydroelectric power, but Iceland has a unique energy source in its geothermal power). Thus, Iceland and Norway are not only the largest producers of electricity (per capita) in the world, but also by far the world’s largest green electricity producers (per capita).

Canada, Finland and Sweden all have extensive hydropower sources and utilize them for electricity generation. Thus, they might be described as semi renewable electric producers (thus marked with light blue color on the graph, whereas Iceland and Norway are marked with dark blue). It is also noteworthy that Canada generates approximately